Wednesday, April 3, 2013

Opening up a Business - April 2013


First Christian Academy, Computer & Technology Class
Group Project:  Integration presentation. April, 2013.


Our next group project will integrate the material we’ve learned throughout the year.  You will get into groups of 3-5 people and decide who is doing what portion of the project.  You’ll turn that in this week.  Then you’ll have about three weeks to work on the project in and out of class, and will then present your project by having your files on your computer for me to check, and presenting the project to the class (5 minutes to present).


You are an entrepreneur and are considering opening a business.  You’ll need to search and hire employees, formulate a budget, prepare a business plan, present your idea to potential investors, design an advertisement, and open up the business!  There are four choices below.  Your group will pick one of the four and also turn that in today.

Business choices:

Coffee Shop.   You’ll open a coffee shop, employ people, and try to make a profit.

Car dealership.   You’ll buy sell and trade used cars.

Cell phone store.   Your store will buy and sell used cell phones.

Tutoring Center.   Your business will help middle and high school students with various subjects.

Here are the minimum requirements to receive a passing grade.  Go above and beyond, make it creative, and receive additional credit.  Each group member will do at least one of the following major parts of the project.  If your group is smaller, each person may need to do two.

Search for employees:  Create a one page job description for at least TWO positions inside the company (ideas here).  How many hours will the job require?  What days and times will the person work?  What will they do?  What skills are necessary to do the job?  How much will the job pay?  THEN find out what it costs to place an advertisement in the Tampa Times or on a job website like Monster.com and list that cost in your advertising budget spreadsheet.

Create a budget:  How much income will the business bring in each month?  For the year?  What will the store cost to operate for a year?  How much is your lease for retail space?  Do you need to buy computers or other electronics?  What will utilities (water, electricity) cost?  Phone / Internet / Cell Phone?  How much will it cost to pay the TWO employees you’ve hired?  Will you have to buy products to sell?  Use a spreadsheet that will total all of these up monthly, and then also show a yearly figure for each row (multiply the monthly by 12 to get the yearly figure).  I will be checking to see if you use FORMULAS for calculations and not a calculator. (this is very important, if you don’t know what that means, please see me quickly).  This is a major part of the project and will take time to do well.  If you do not use for formulas you will lose at least 10 points on the project. Your spreadsheet should look similar to the one we worked on in this assignment.

Prepare a business plan.  Start here to see a sample of a business plan.  Complete at least three sentences for each of the items; Business Plan Executive Summary [5-10 sentences that describe what you’ll be doing], Market Analysis [who are your competitors?], Company Description, Organization & Management [who is doing what?], Marketing & Sales Management [how will you advertise and get customers?], Service / Product Line [what will you be doing or selling?].  Use google docs or word or similar to create a nice looking business plan.  It should be at least one page, no more than two.  This is also a major part of the project.

Present your idea to potential investors.  Create a presentation [google docs, power point, keynote or prezi.com] that has at least 10 slides.  It should show a summary of what you want to do for a business, and give an idea of how much money the potential investor could make.  Use pictures.  Use graphs if you like.  Important:  how many items or services will you need to provide in order to cover your expenses and make a profit?  (remember the expensive drink store story from class).

Design an advertisement.  Use whatever software you like to create an advertisement.  It could be a nice looking presentation slide (google docs or power point) or a video or something else creative.  Make it interesting, creative, and clear to see what you’re selling or the service you provide.  You could also create an infographic, see http://www.entrepreneur.com/blog/225095#  (try using infogr.am, piktochart or easel.ly)

This project is DUE Wednesday May 1, 2013 at the beginning of class.  You will be graded on progress each week.  Be prepared to show me your progress at the beginning of class each week.  Have all documents on on your computer (google docs or similar).

(on the next page, there is a turn in page to tell me what business you’re opening up, and list who is doing what on the project.)
Turn this sheet into Mr. Caldwell.  ONE per GROUP. April 2013.


The business we are choosing to open is (check the box next to the one you’ll open)


⇵Coffee Shop.  You’ll open a coffee shop, employ people, and hope to make a profit!
⇵Car dealership.  You’ll buy sell and trade used cars.
⇵Cell phone store.  Your store will buy and sell used cell phones.
⇵Tutoring Center.  Your business will help middle and high school students with various subject.


Now, write in the names of who will be doing what.  If your group has THREE members, then at least two of them will be doing TWO of the items below.  If your group has FOUR members, then one person would be doing two of them items.  If your group has FIVE members, each member does one of the below:


Job Descriptions / Search for emp: ____________________________________


Create a Budget / Spreadsheet: ____________________________________


Prepare a Business Plan: ____________________________________


Present your idea to investors: ____________________________________


Create an advertisement: ____________________________________

By signing above, you agree you have read this entire project assignment and understand this is a large project that will require you to work a number of hours in total in the next few weeks.

This project is DUE Wednesday May 1, 2013 at the beginning of class.  You will be graded on progress each week.  Be prepared to show me your progress at the beginning of class each week.  Have all documents on on your computer (google docs or similar).

Wednesday, March 6, 2013

Creating an InfoGraphic - March 2013

Creating an InfoGraphic | March 6, 2013
First Christian Academy
Mr. Caldwell sean@firstchristianacademy.com


Infographics are a great way to present information in an easy to understand way.  They use facts and numbers and combine them creatively to present something that looks like this:


Or like this:


Your assignment is to use one of the online tools we discussed to create an infographic.  See http://www.entrepreneur.com/blog/225095#  (try using infogr.am, piktochart or easel.ly).  Topics could include school, your family, or anything I approve in class.  You could be serious with factual data, or funny with made up numbers.  Consider what you want to convey to your audience and then start to collect some data.  This assignment should take you one to two hours to complete and is due at the beginning of class next week, March 13, 2013.

Save the infographic on the site that you use to create it and also download it to your local computer.  email it to yourself so that even if your computer is not working you can still access it.

I can’t wait to see how creative you can present some data.

Sunday, February 10, 2013

Group Project #1


First Christian Academy, Middle School technology and computers

Group Project 1, February 13, 2013. Due February 27, 2013.
Assignment value:  120 points (20 points for progress next week, plus 100 for the final project).

Get into groups of 4 people (3 or 5 with approval from me).

For this project, you’ll work in a group to accomplish a task using computers and technology.  You’ll be graded on the quality of the group’s work, and the depth of the piece.  Does it look like your group spent time on it?  Whatever you choose to do, do it well!  If the rest of your group says that you didn’t do any work on the project, don’t expect any points.


Ideas:

  • Create a video 3-5 minutes in length that promotes an idea or sells a product (real or fake).
  • Make a website that promotes an idea or sells a product (real or fake).  Suggestion to use wordpress.com as the engine for the site.  The site should have at least 3 pages on it.
  • Create a presentation (at least 15 pages) that promotes an idea or sells a product.  Then present to the class.
  • Create a skit that lasts 3-5 minutes and record it on the computer or phone.  All group members play a part.
  • Make a cookbook with at least 10 recipes.  Insert pictures and make it look great.

Next week, I want ONE person in the group to show me a document that details out what each person in the group will be doing for the project (editing video, collecting pictures, writing scripts, etc.) and see some progress on the project.  Everyone in the group must have a portion of the project to do.  This will be taken into account if the project is not complete...it will be possible to see who did or did not follow through on their commitment.

The project is due in two weeks; February 27, 2013.  Start working on it now.  We will check on the progress that you’re making next week and you will receive a grade for progress.  You’ll show the project to the class as a group.  Then the entire class will vote for best group for extra credit.

Wednesday, January 30, 2013

Spreadsheets - Graphs. February 2013

FCA Technology and Computer Class
2013
Mr. Caldwell
sean@firstchristianacademy.com


Introduction to Spreadsheets, part 3
January 30, 2013


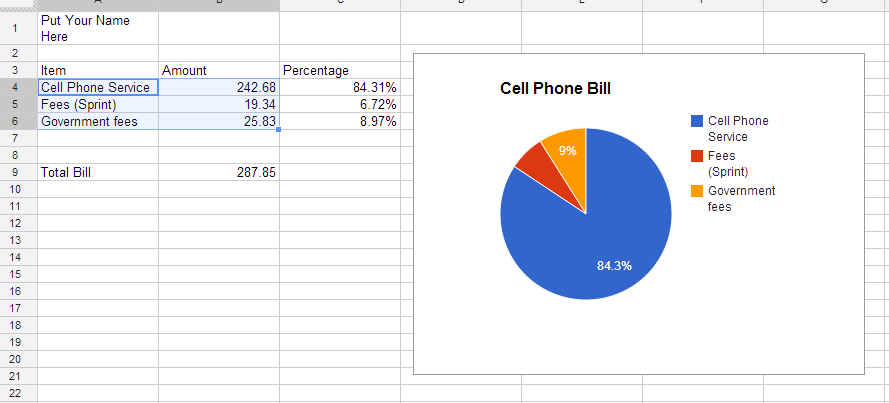
We’ve learned how to do a simple spreadsheet with numbers, then percentages.  This week we’re going to insert TWO graphs that will visually show our how our budget looks.  Then we’re going to do another spreadsheet based on a cell phone bill and create a chart there as well.

Open your spreadsheet from last time (it can be the one with or without percentages).  Then select FILE, MAKE A COPY.  Name it “Spreadsheet 3 YOUR NAME Graphs”.  Then select OK.  We’re now working on a new copy of the file.  Select the data as we showed in class and then select insert in the menu.  Select chart.

Choose a chart type.  Note that only some of the chart types will apply to the data we have.

Your chart should show the numbers (or percentages in a pie chart).  Both the data and the labels must display for the assignment to be complete.  If you have many items, not every slice of the graph will have a percentage listed.

Once you have inserted ONE type of chart, please do the same thing and insert a SECOND different type of chart.  My recommendation is to do a PIE chart and also a BAR chart.

Please re-read these instructions before turning in the assignment to get full credit.
2 Points extra credit:  create and insert a total of 4 different chart types.


The chart could look something like this:


For the next part of the assignment, you’re going to need to get the cell phone bill from your parents.  If you don’t have a cell phone bill, then use a cable bill.  If you have neither a cell phone or cable, come see me for other options.
We’re going to add another SHEET to our current spreadsheet like shown in class.  Name the sheet cell phone bill.

Look at the bill.  Find the base price for service, then find all the fees and taxes.  Set up your spreadsheet to look similar to this and then create a pie chart that shows the item (service, fees, tax, etc.  Not more than 5 items are needed.).  Both the data and the labels must display for the assignment to be complete.
Here’s an example:


Assignment is due: Tuesday, February 5, 2013 before 8pm.  This is before our next class. 10 points deducted for each late day.  Please turn it in on time and get full credit.

How to turn in your assignment:  While the document is open, click the SHARE button in the upper right hand corner.  Then where it says “add people” type sean@firstchristianacademy.com and leave “can edit” selected, then press share in the lower left hand corner.  email me if you are having trouble before Tuesday.

Wednesday, January 23, 2013

Spreadsheets 2, percentages

Today we're building on what we did last week by adding in percentages next to the yearly total column.

FCA Technology and Computer Class 2013
Mr. Caldwell
sean@firstchristianacademy.com


Introduction to Spreadsheets, part 2
January 2013


Last week we learned how to setup a basic spreadsheet to track a household budget.  This week we want to add on to that spreadsheet so that we can see the percentages that each category contains.  In class we saw how to find the percentage by dividing each category by the monthly total.

For example:
Rent 1000
Taxes 400
Electricity 200
Phones 200
Entertainment 100
Food 100
Total:  $2000 per month.

What percentage is electricity?  200 divided by 2000 is .1  = 10%.
What percentage is food?  100 / 2000 = .05 = 5%
Each time we divide, we want to divide BY the same bottom number (in this case it’s 2000).

We need to set up the spreadsheet so each number also has a percentage next to it, like the example below.  Remember, use the numbers you used from last week, not my numbers.  Also, remember how important it is to reference the ABSOLUTE cell for the monthly total by putting “$” in front of the cell column and row identifier, for example the formula might look like this:  =SUM(C1/$C$15), then you can copy the formula down and it will do all the computations for you like we saw in class.

You’ll need to format that column as percentage by highlighting the numbers and clicking the % sign in the toolbar or highlighting the column and selecting format, number, percentage.


Item Amount percentage

Electricity 200 3.58%
Water 75 1.34%
Car 500 8.96%
Rent 1500 26.88%
insurance 500 8.96%
Phone Bill 300 5.38%
Food 300 5.38%
Clothing 200 3.58%
Cable TV 250 4.48%
Education 700 12.54%
Pool service 55 0.99%
Cleaning 300 5.38%
Property Taxes700 12.54%


Monthly Total 5580
Yearly Total 66960

Your assignment should look similar to this when you're done:


Assignment is due: Wednesday, January 30, 2013.  10 points deducted for each late day.  Please turn it in on time and get full credit.

How to turn in your assignment:  Show me your assignment in class.

Wednesday, January 16, 2013

Introduction to Spreadsheets

FCA Technology and Computer Class
Winter 2013
Mr. Caldwell
sean@firstchristianacademy.com


Introduction to Spreadsheets. January 2013


Spreadsheets are tools used to manipulate numbers.  Almost any math function (addition, subtraction, multiplication, averaging, etc.) can be completed on numbers or sets of numbers. It's better than a calculator in many ways.

Here are some important terms:
Worksheet.  The page that contains all the numbers and formulas.
Cells.  Each individual box on the worksheet is called a cell.  Each cell is referenced by a letter and number.  Examples:  A7.  G32.  K55.  Cells can contain numbers OR letters/words
Formula.  A math function that is completed on a range of cells.  It can also include computation on a range of cells.
Range.  A series or group of numbers that the formula will be applied to.  A range might look like:  A1:G1

Some basic Formula names:
Sum.  A formula that computes the total of a series of numbers.
Average.  The average of a range of numbers.  Example:  the average of 10 and 20 is 15.
Max.  The highest value that appears in a range.
Min.  The minimum number that appears in a range.


Your first assignment using spreadsheets is to create a worksheet that is a simple family budget.  We’ve covered how to do this in class, please feel free to contact me if you’re confused.

Include your name at the top, name your spreadsheet, and then estimate and enter values for:
Rent or Mortgage.
Food.
Water.
Taxes.
Charitable Giving (or tithes to church)
Clothes
Electricity
Vehicles (car payment or lease payment estimate, or if paid for the estimated monthly maintenance cost)
Phones (land line and/or cell phones)
Entertainment (tv, movies, video games, concerts, etc.)
and any other category you want to include in your monthly budget.

Include the NAME of the expense on the left side, then include the amount one or two columns over.  Include a total monthly amount at the bottom.  You must use a formula to come up with the total, not type in a number.  5 Points extra credit:  take the monthly total and also give a yearly total by using a formula to multiply the monthly total by 12.  (hint:  *12 is how to multiply by 12 on a spreadsheet).


It should look similar to this:


Ask your parents to help come up with the numbers.  These are only estimates, made up numbers are fine to use as well if you or your parents don’t want to share some of them.

Assignment is due: Wednesday January 30, 2013 (in two weeks).  We will add some items to it next week. Turn it in a week early and get extra credit.  10 points deducted for each late day.  Please turn it in on time and get full credit.

How to turn in your assignment:  You will show me your assignment.

Wednesday, January 9, 2013

Using Picasa to make a picture slide show / video

1/9/2013

Today's assignment is to work with the 10 pictures you brought from the Christmas break and make a picture slide show / video.

Select the pictures inside Picasa.  Then click Create then Movie then from selection.  We'll work on it in class and you'll be graded next week.

Please check engrade to make sure your grades are up to date and you have turned in all assignments.